Making money in 2018 hasn’t been easy. In fact, 90% of the 70 asset classes (covering everything from stocks to bonds and commodities) tracked by Deutsche Bank posted negative total returns in dollar terms for the year through mid-November, per The Wall Street Journal.
That’s the highest percentage on record going back to 1901 (the previous high was in 1920, when 84% of 37 asset classes were negative). While a single year is not a very long period of time, the simultaneous “failure” of so many investment strategies is unusual and likely unnerving to some investors.
Yet these are the conditions in which a conservative dividend growth strategy is designed to thrive. When asset prices stagnate or even decline, dividends are meant to serve as a stabilizing source of return and continue providing a predictable source of income.
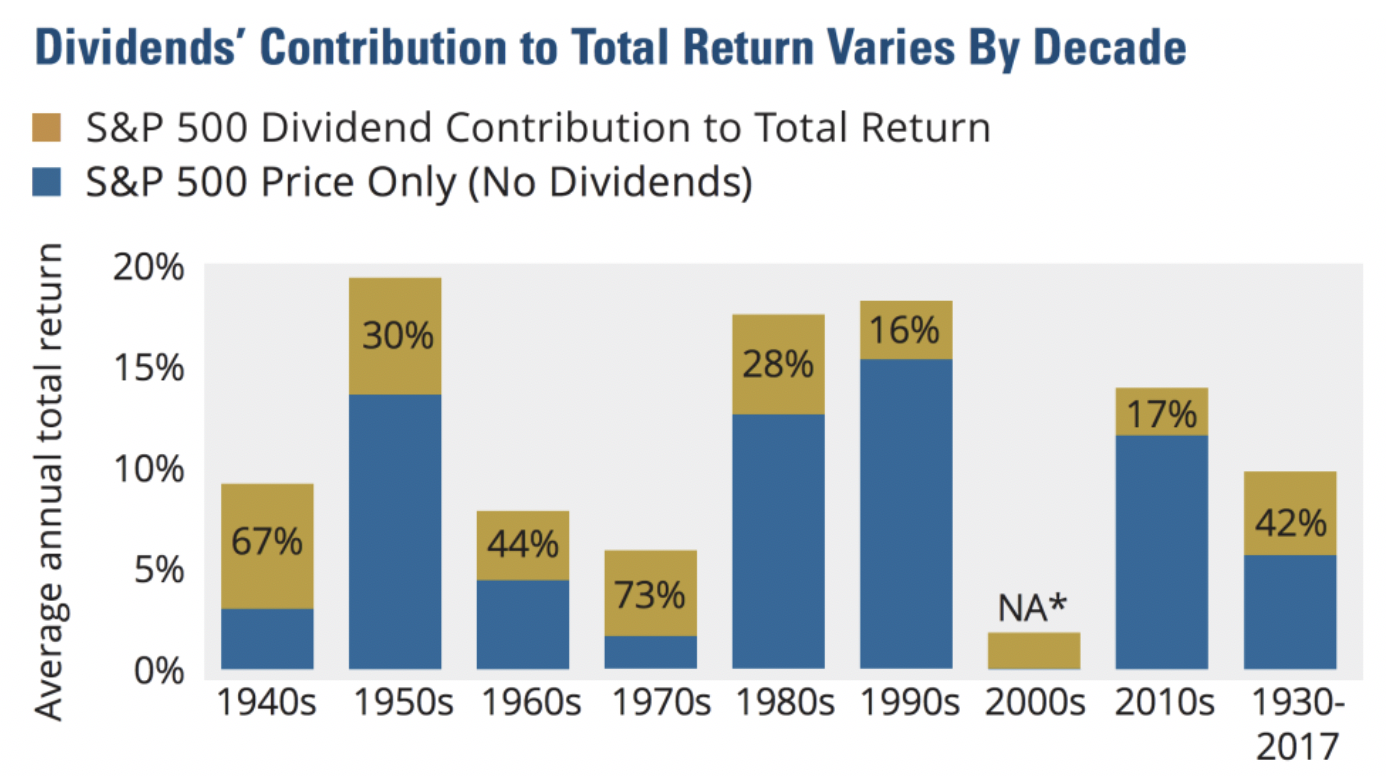
In the 1970s, for example, the oil crisis and Watergate resulted in a deep, prolonged bear market. The S&P 500 peaked in early 1973, slumped nearly 50%, and did not recover to reach a new all-time high until 1980. However, dividends continued rolling in during this disappointing decade and ultimately accounted for 73% of the market’s 5.8% average annual total return in the 1970s according to data provided by Hartford Funds.
A similar story played out in the 2000s, when the S&P 500’s price actually declined 2.7% per year thanks to two severe bear markets. Dividends contributed a positive total return of nearly 2% per year, helping buoy the market’s disappointing returns. You can see the importance of dividends to the S&P 500’s returns below:
Source: Hartford Funds
In theory, a retirement strategy focused on generating income from dividends does not need to worry much about broader fluctuations in asset prices. So long as the dividends continue rolling in, one’s lifestyle can be maintained regardless of whether the stock market is up or down.
However, the last two months spotlighted a major potential pitfall of such a strategy: dividend cuts. Banking on dividends doesn’t work so well if a company you own slashes its payout. Not only do you have to find a replacement source of income, but many times a stock’s price takes a big hit on the news, leaving you with less capital to invest elsewhere.
Many investors will try to find stocks with safe dividends by looking primarily at a company’s payout ratio (the percentage of earnings or cash flow consumed by the dividend) and long-term track record of paying dividends without a cut (indicating management is committed to the dividend). Unfortunately, that simplistic approach doesn't always work.
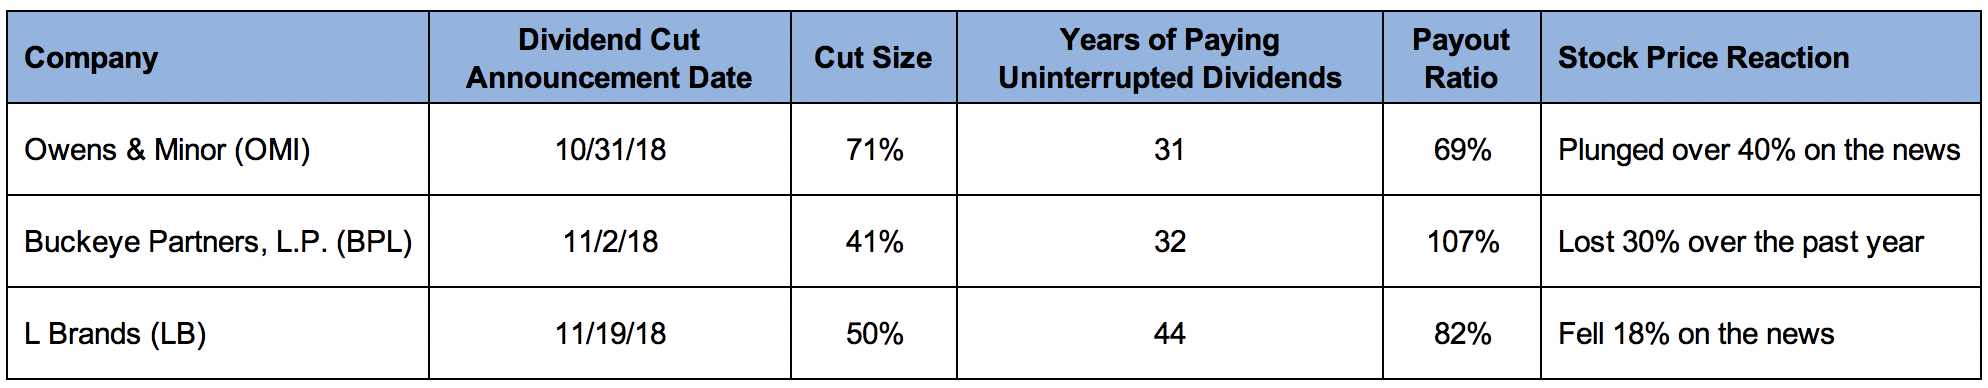
For example, Owens & Minor (OMI), Buckeye Partners, L.P. (BPL), and L Brands (LB) had all paid uninterrupted dividends for more than 30 straight years, but in 2018 each firm cut its dividend between 41% and 71%. Share prices of OMI and LB fell over 40% and 18%, respectively, on the news.
Source: Simply Safe Dividends
A retirement portfolio invested heavily in these stocks could have lost tens of thousands of dollars in a single day. Our goal is to help you avoid situations like these so you can generate safer income, preserve capital, and enjoy retirement with fewer worries.
To that end, we’ve spent thousands of hours and invested hundreds of thousands of dollars to develop and maintain a Dividend Safety Score system designed to identify companies at risk of future dividend cuts.
As big believers in transparency, we publish the realtime track record of our Dividend Safety Scores here. Since going into business in 2015, we have caught over 98% of dividend cuts in advance, including Owens & Minor, L Brands, and Buckeye Partners, L.P.
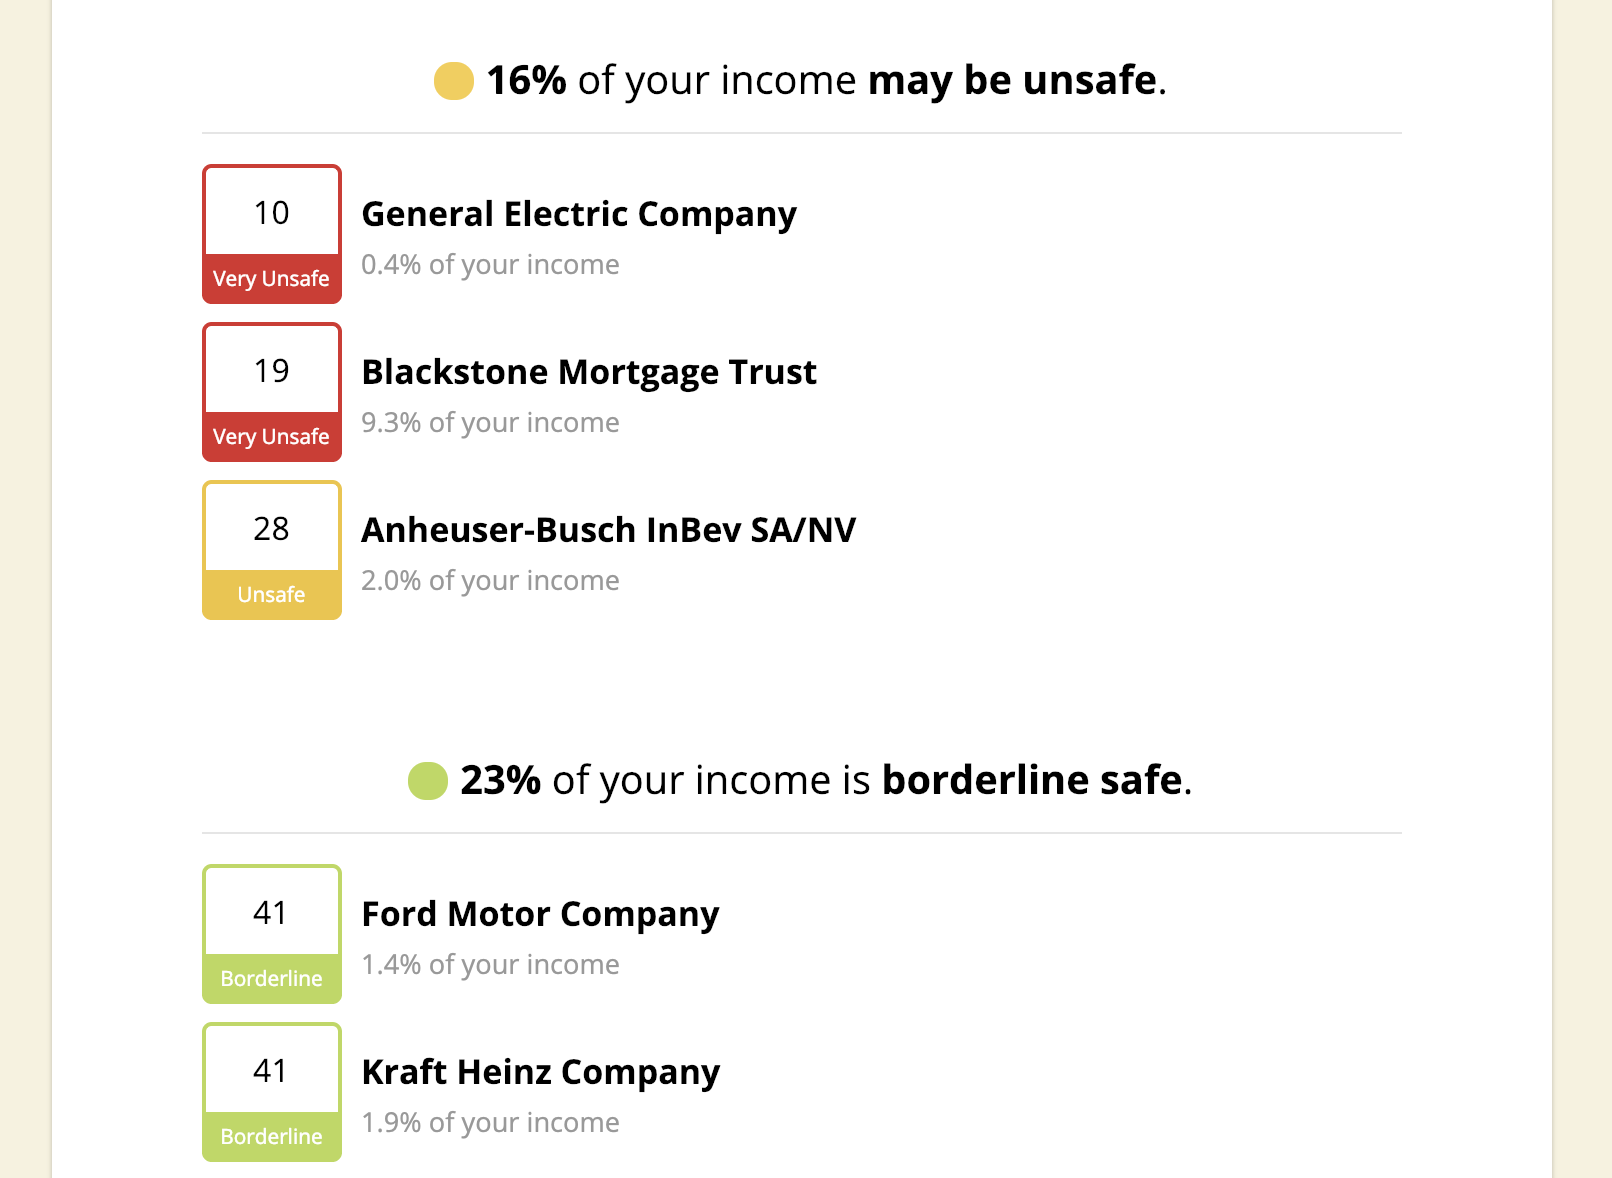
L Brands scored below 25 points (falling into our “Unsafe” and “Very Unsafe” ratings) for more than a year prior to its dividend cut.
Similarly, Buckeye Partners, L.P. scored below 40 points (“Unsafe” and “Very Unsafe” ratings) over a year before slashing its distribution.
And Owens & Minor scored in the low 40s a year ago (the lowest “Borderline Safe” rating) before falling below 40 (“Unsafe” and “Very Unsafe” ratings) nine months before its cut.
We even published articles warning of possible dividend cuts from these businesses. If you owned any of these stocks in your portfolio, besides seeing their poor Dividend Safety Scores, you would have received an email when our notes below were published.
I’m not bringing up these examples to boast. I have plenty of tracks on my back as an investor, and certainly no system out there is ever going to be completely perfect. Financial markets and the world itself are far too random and dynamic to allow that to happen.
However, I realize that the online financial world is a wild, wild West. Anyone with a computer and cheap internet access can launch a newsletter or investing website, regardless of their background and investment experience. Regulatory oversight is minimal at best, sensational claims are the marketing de jour, and few authentic track records are made publicly available.
In a world filled with noise, I take your trust in Simply Safe Dividends very seriously. Choosing to lean on us to help you advance your retirement goals is a big deal.
On that note, I want to take this opportunity to shed more light on some of the behind-the-scenes work we do and guiding principles we follow to keep our Dividend Safety Score system running as smoothly and effectively as possible to help you generate safe income.
Garbage in, garbage out is an expression that describes when flawed input data produces a nonsense output. With so much financial data out there covering thousands of companies, this can be a real issue when trying to analyze the safety of a company’s dividend.
When I was a partner and equity research analyst at a large investment fund, we needed every piece of information we used in our investment process to be accurate, trustworthy, and insightful. We subscribed to Bloomberg, FactSet, Thomson One, Capital IQ, and various other data feeds. And they were worth every penny.
Similarly, at Simply Safe Dividends, we pay a lot of money each year for access to institutional quality data feeds that serve as a backbone for our Dividend Safety Score system. By having a greater breadth and depth of accurate information at our fingertips, we can better assess risk.
For example, our scores are able to account for complicated issues like a retailer’s operating leases, a form of off-balance sheet debt. We can see that GE has a significant pension funding shortfall. And we have access to industry-specific metrics like adjusted funds from operations for REITs and distributable cash flow for MLPs to better analyze their underlying economics.
We also receive forward-looking analyst estimates. While I take forecasts with a grain of salt, it is helpful to quickly spot companies with deteriorating health. All of this data is piped into our system every day, ensuring that our scores incorporate the latest and greatest financial information reported by each of the 2,000+ companies we have rated for Dividend Safety.
But having a lot of high quality, up-to-date financial information is only part of the picture. You have to know what to do with it. Back in my days at the investment fund, I was a generalist analyst, meaning I was not tied to any one sector with my research duties. Instead, I studied stocks across many sectors of the market, including industrials, materials, tech, and consumer.
After spending well over 10,000 hours researching hundreds of publicly traded companies, you pick up on the nuances that each industry has. Some, like steel, are driven almost completely by the price of a cyclical commodity. Steelmakers can swing from high profits to an operating loss in a hurry, especially given the high fixed costs of their businesses.
Others, like regulated utilities, can afford to maintain higher payout ratios and more significant financial leverage thanks to the steady, predictable nature of their cash flow. We incorporate this intelligence into our Dividend Safety Score system, carving out dozens of industry templates (and adding more over time as the need arises).
Within each industry group, we work to identify the metrics that matter most, determine which values are risky or safe for each indicator, and find the right level of sensitivity a company’s score should have to each interrelated metric.
As Owens & Minor, L Brands, and Buckeye Partners, L.P. demonstrated, many times you need to go beyond a company’s historical dividend track record and payout ratio to assess dividend safety. But it can be done, and usually far in advance of a dividend cut being announced. From EBITDA to free cash flow, debt, and liquidity measures, our system scrubs a comprehensive set of critical financial factors.
Another important element to understand about our Dividend Safety Score system is that we take a long-term, conservative view when assigning ratings. When we assess dividend risk, we are trying to look out over a full economic cycle – not just next quarter. Many companies possess risk factors that are dormant during strong economies but can put their payouts on the chopping block whenever the next recession hits.
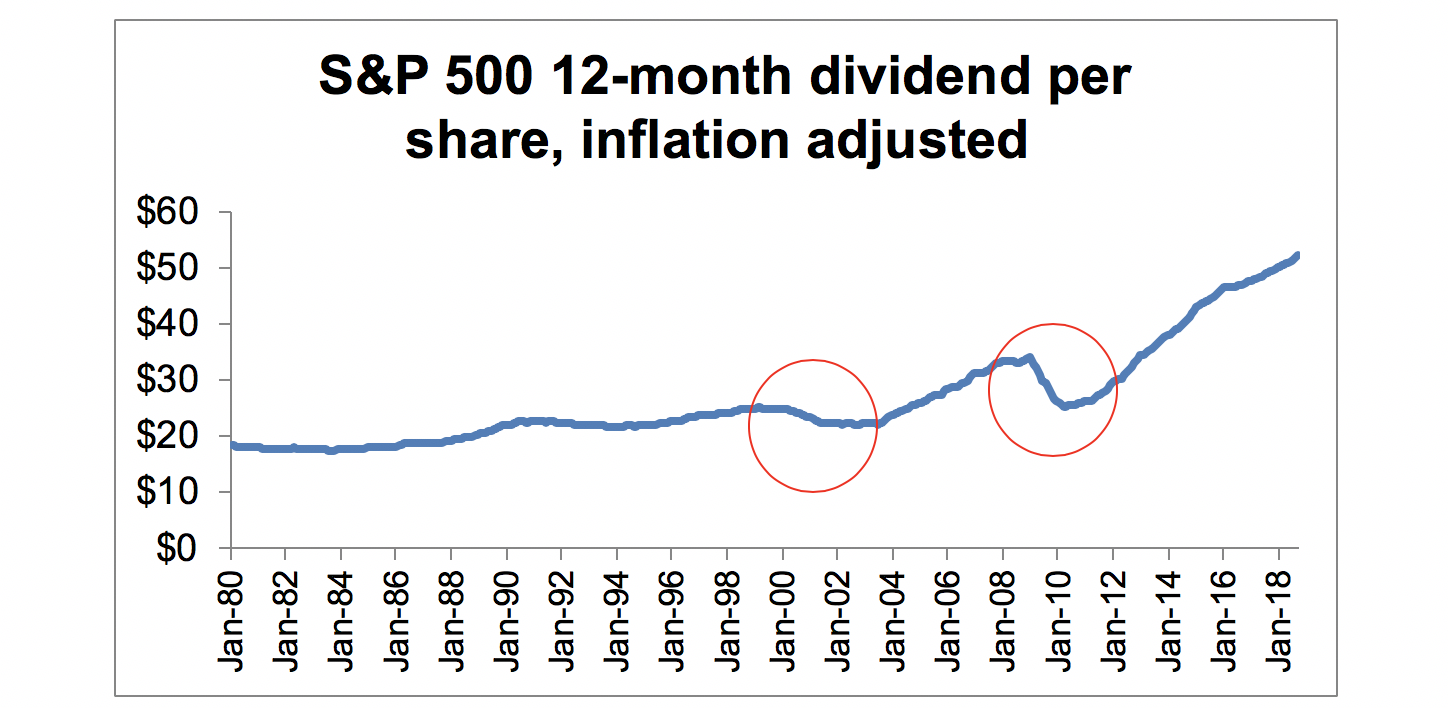
As you can see below, dividend cuts tend to come in waves. Roughly one in three dividend-paying companies in the S&P 500 reduced their payouts during the financial crisis, for example. Since no one can predict when the next downturn will hit, we prefer to help keep conservative income investors steered away from the more vulnerable companies well in advance.
Source: Multpl.com, Simply Safe Dividends
The last thing we want to do is have a company with a risky dividend look safe. If a company has a big red flag or two (high leverage, cyclical operations, etc.), it will struggle to achieve a high Dividend Safety Score. So while a low score does not necessarily mean a dividend cut is imminent, these firms often depend on favorable business, financial, and economic conditions to maintain their dividends. The margin for error is low.
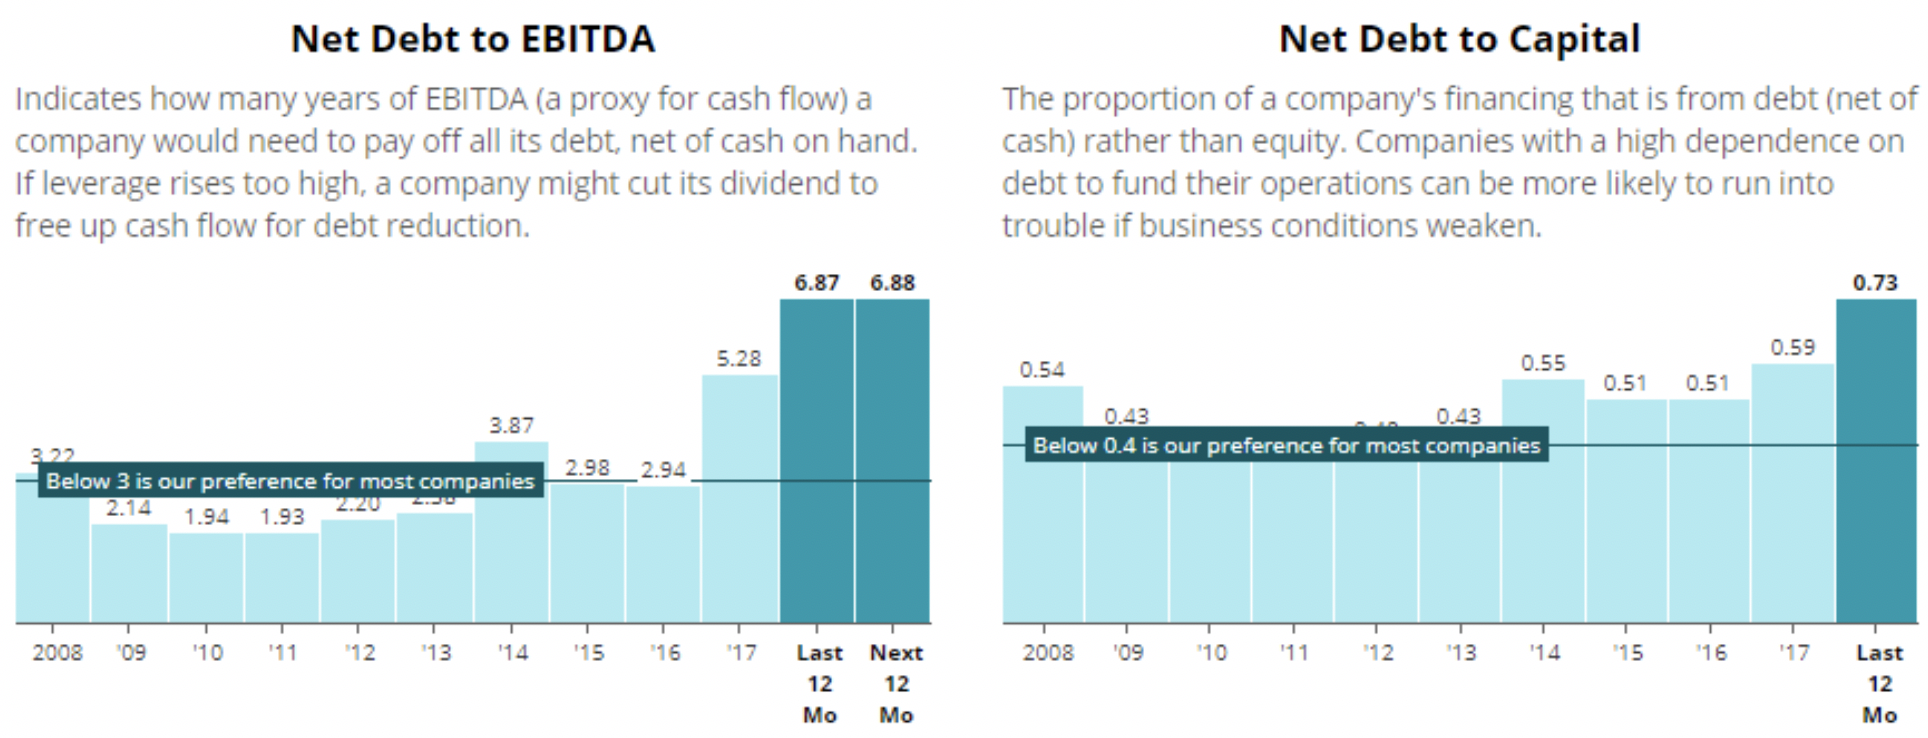
Owens & Minor is a good example. While the firm had a payout ratio below 100% (earnings more than covered its dividend) and a culture that seemed committed to the dividend (uninterrupted payouts since 1977), you could see the business faced an alarming amount of financial stress.
Thanks to falling earnings and a spike in debt resulting from two major acquisitions, the firm’s leverage jumped to very risky levels. A substantial dividend cut would give the company more breathing room to improve its balance sheet, and that’s what happened. As a conservative investor, I like to keep my portfolio far away from these types of situations. Instead, I like to own companies with scores close to 60 or above (our “Safe” and “Very Safe” categories). Nearly 800 companies in our database are in these categories, providing plenty of opportunity to build a well-diversified dividend portfolio.
Perhaps most importantly, our Dividend Safety Score system isn’t some sort of static, systematic machine with little to no human overlay. It’s a living, breathing body of work that is continuously being scrutinized for improvements.
Each day I monitor any meaningful Dividend Safety Score changes across our entire database to ensure they appear to be reasonable. On an ongoing basis I also personally review numerous companies and industries to see if we can do an even better job of assessing their dividend risk profiles. I don’t take those responsibilities lightly.
Thanks to our members' support and referrals, virtually all of our time and energy is able to be spent on further enhancing our Dividend Safety Scores, publishing investment research, and building out our website’s tools rather than spending resources trying to market and grow our business.
If you are interested in learning more about your portfolio's Dividend Safety, you can try out our service for free here.