While dividend growth investing can be a solid way to grow your income and wealth over time, even the best company can make a bad investment if you grossly over pay for it.
This means that investors are generally better off following Warren Buffett's mantra that "it's better to buy a wonderful company at a fair price than a fair company at a wonderful price".
But how exactly do you determine what a "fair price" is?
After all, there are numerous ways to value a company, including P/E ratios, cash flow multiples, price-to-book value, discounted cash flow models, and more. None are 100% objectively correct, and all have their limitations.
Dividend yield theory is a lesser-known valuation method that has proven to be reasonably effective for stable income producing stocks. Let's take a look at what dividend yield theory is, why it works well over time, and what limitations it has that make it inappropriate for certain kinds of stocks.
We'll also walk through an example of how to use the dividend yield theory valuation model to hopefully give you an idea of how to avoid overpaying for quality dividend stocks and thus maximize your long-term income and returns.
What is Dividend Yield Theory?
Dividend yield theory has been around since at least the 1960s and was popularized by asset manager and investment newsletter publisher Investment Quality Trends, known as IQT.
Dividend yield theory is simple and intuitive. It basically says that for blue-chip dividend stocks, meaning those with stable business models that don't significantly change over time, dividend yields tend to revert to the mean.
In other words, a stock's dividend yield fluctuates around a relatively fixed level over the years that approximates fair value. If the stock's current yield is far enough above its historical yield, then the stock is likely undervalued. And if its yield is beneath its historical norm, then the stock could be overvalued.
Source: Simply Safe Dividends
The reason this makes intuitive sense is because stock prices follow earnings over time. As Warren Buffett stated:
"If you aren't willing to own a stock for ten years, don't even think about owning it for ten minutes. Put together a portfolio of companies whose aggregate earnings march upward over the years, and so also will the portfolio's market value."
So if stock prices follow earnings, and blue-chip dividend stocks tend to pay out a consistent amount of their earnings as dividends (i.e. they maintain a stable payout ratio and safe dividend), then there could be a connection with stock prices tracking dividends as well.
Even better, since dividends tend to be much less volatile than earnings and are an important component of total return for blue-chip dividend stocks, dividend yield can be a less noisy indicator of value.
Investors can monitor a dividend stock's yield over time to get a feel for its usual trading range. Then, if the market overreacts enough to an event that does not impact a company's long-term outlook but sends its stock price soaring or crashing, the result is an unusually high or low dividend yield.
Dividend yield theorists believe the stock's yield will eventually revert to its longer-team norm, assuming nothing has changed with the business (which is typically the case with blue-chip stocks since they are relatively stable, mature businesses with staying power).
But what's the track record for this model? Theories are great, but ultimately they are useless if they don't accurately reflect market reality. Fortunately, dividend yield theory has a solid track record.
Historical Track Record of the Dividend Yield Theory
IQT has a model portfolio that consists of all the stocks the firm has identified in its "Undervalued" and "Rising Trend" categories. Simply put, these stocks have dividend yields that are unusually high compared to their long-term norms, making them undervalued mean reversion candidates.
However, it's worth noting that the firm's universe of investment candidates is limited to less than 300 U.S. companies that it identifies as blue chips and has established "clear-cut dividend-yield profiles" for.
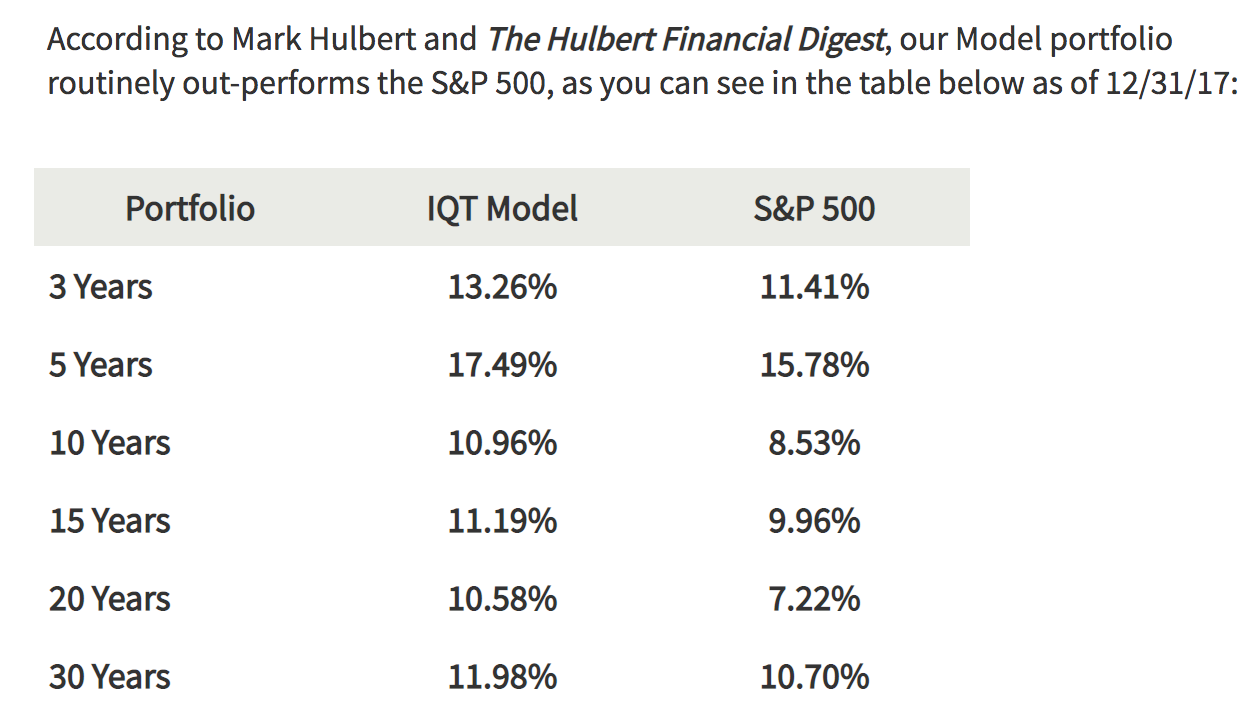
The Hulbert Financial Digest tracks hundreds of investing newsletters over decades to verify their long-term results. Since it began tracking IQT's model portfolio in 1985, the dividend yield-driven approach has historically beaten the stock market by impressive amounts.
Source: Investment Quality Trends
Thus, for companies possessing the blue-chip qualities IQT looks for, which are listed below and can be further studied here, the dividend yield theory appears to do a solid job of identifying reasonably valued stocks while steering clear of those that are excessively priced.
"The IQ Trends register of Select Blue Chips is an elite representation of the highest quality and most prosperous corporations in the country. According to our method, a stock will achieve the designation of Select Blue Chip after it has met at least five of the six following qualifications and may remain with four criterion.
1. Dividend increases 5 times in the last 12 years 2. S&P Quality Ranking in the “A” category 3. At least 5,000,000 shares outstanding 4. At least 80 institutional investors 5. At least 25 years of uninterrupted dividends 6. Earnings improved in at least 7 of the last 12 years"
IQT's results are particularly impressive and supportive of the dividend yield theory's efficacy in this light. Specifically, the firm's blue-chip criteria likely means that a significant amount of its model portfolio is invested in S&P 500 companies rather than smaller and faster growing companies.
In other words, rather than buying a bunch of companies outside of the S&P 500, much of the excess return generated by IQT's model portfolio appears to have been driven by its strategy of purchasing blue chips only when their stocks were historically undervalued (i.e. they had abnormally high dividend yields), and then holding for the long term or until they became grossly overvalued enough to warrant a profitable sale.
But how exactly does one use the dividend yield theory for their own investing? Let's look at a few examples.
Dividend Yield Theory Examples
It's important to remember that dividend yield theory works best over long time periods (5+ years) and is best used for stable blue-chip stocks.
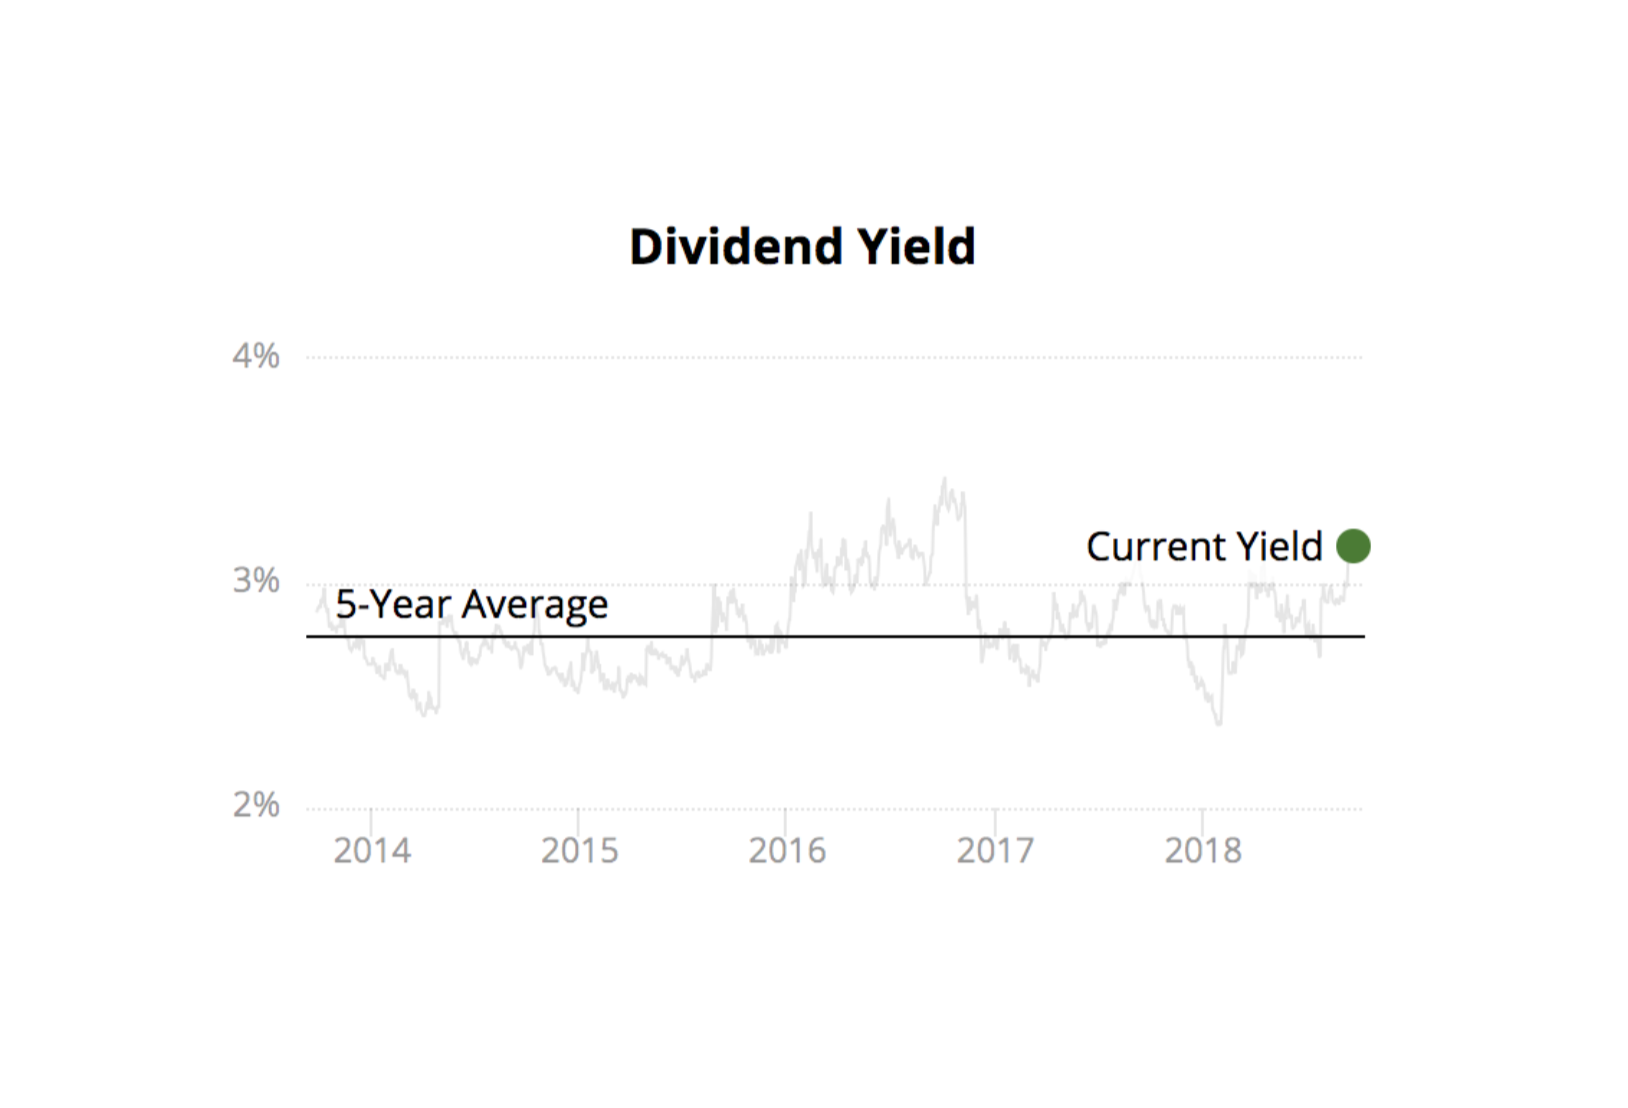
PepsiCo (PEP) is a solid candidate. The global food and beverage giant owns over 20 billion dollar brands including Frito-Lay, Gatorade, Tropicana, Quaker, and Pepsi-Cola.
Besides its well-known brands, PepsiCo’s primary competitive advantages are its large scale, balanced product portfolio, and extensive distribution network. These factors have made the company a cash cow and allowed it to pay uninterrupted dividends since 1965, including more than 40 consecutive years of payout increases.
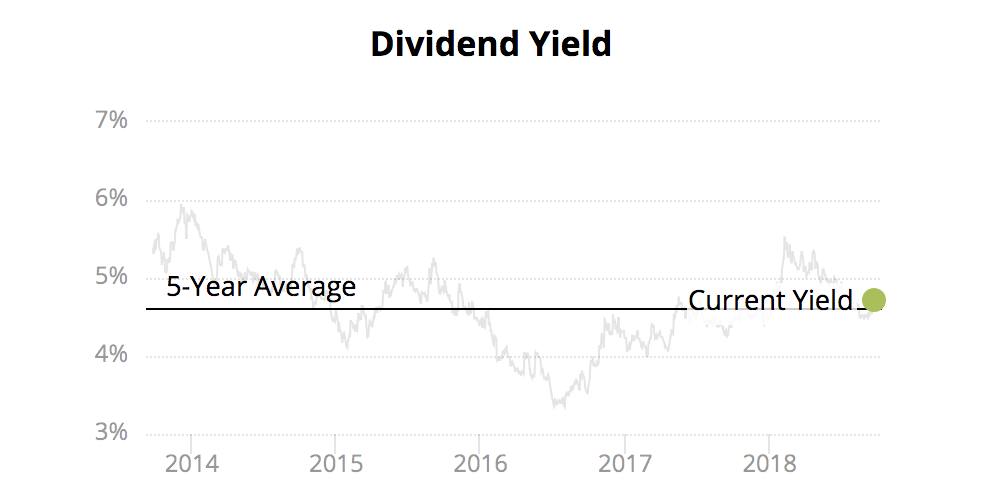
Throughout most of the last five years, you can see that PepsiCo's stock traded at a dividend yield above 2.5% but below 3%, good for an average of 2.8% over this time. However, in early 2018 PEP's dividend yield shot well above its historical norm, quickly rising to nearly 4%.
Pepsico (PEP)
Two factors drove the dividend yield spike. First, the broader market dropped 10% after hitting an all-time high in late January. The Consumer Staples sector performed even worse, slumping more than 15% between the end of January and early May as investors fretted over future growth prospects and cost inflation.
PepsiCo was swept up in the sector's broad-based selloff as well, pushing its dividend yield higher. Additionally, management increased the firm's dividend by 15%, beginning with its June 2018 payment. This was an unusually strong payout raise for the company (PepsiCo's 5-year average annual dividend growth rate was 8%) and pushed its yield even higher given the slump in its stock price.
Despite its unusually high yield, PepsiCo's fundamentals remained solid. At the time, the company had last reported earnings on February 13, 2018. Excluding foreign currency fluctuations, organic sales grew 2% and earnings per share rose 8%. In addition to the 15% dividend increase announcement, management issued guidance for 9% earnings per share growth in 2018.
Simply put, PepsiCo's business remained healthy, and its long-term outlook appeared to remain intact. It's impossible to predict short-term market sentiment, which drives share prices over any one- or two-year period. But over the long term (5+ years), PepsiCo's yield seems likely to continue reverting towards its historical norm due to the company's solid fundamentals.
Besides identifying potentially timely buying opportunities, dividend yield theory can play an important role in helping investors avoid excessively priced stocks.
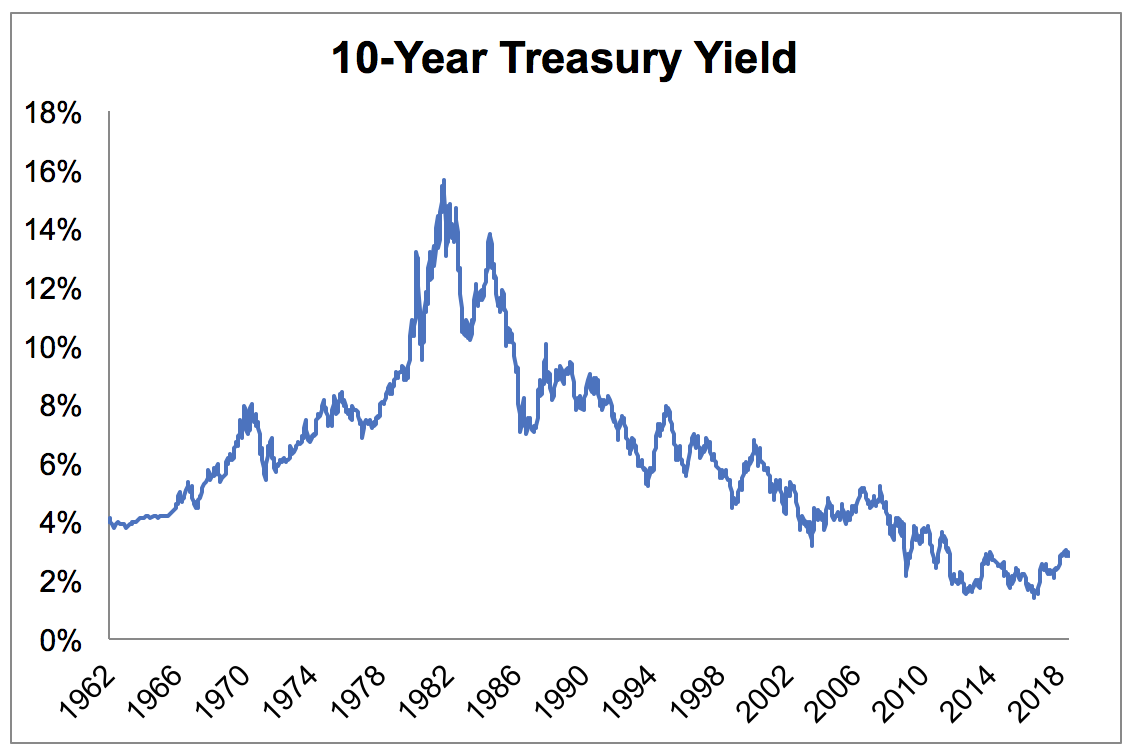
In today's low-yield world, that's been an especially important benefit. As you can see, long-term bond yields dipped below 2% to reach a historic low in 2016. Yield-starved investors needed more income and began reaching for bigger returns by pouring money into bond-like stocks such as utilities and REITs.
Source: St. Louis Federal Reserve, Simply Safe Dividends
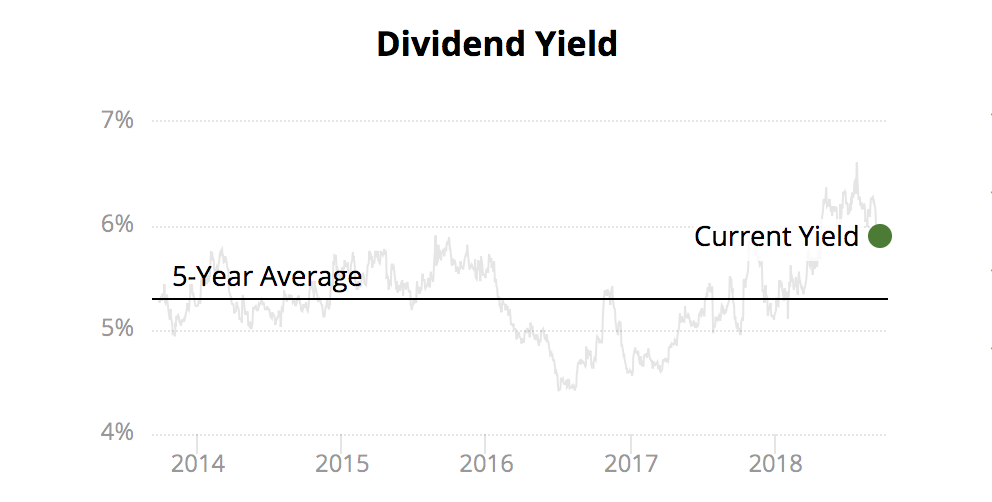
Realty Income (O), a blue-chip retail REIT that has paid uninterrupted dividends for nearly 50 years, was a beneficiary of this development. As interest rates crept lower and lower, O's stock price moved higher, pushing down its yield.
Long-term rates bottomed in the summer of 2016, coinciding with the abnormally low dividend yield offered by O shares. Income investors considering Realty Income would have seen the stock's expensive yield and hopefully known to have waited for a better pitch.
Sure enough, as interest rates increased over the last two years, Realty Income's dividend yield reverted back to its long-term average, providing a more reasonable valuation for income investors today.
Realty Income (O)
While dividend yield theory can be an insightful valuation model, there are several important limitations investors need to keep in mind.
Limitations of the Dividend Yield Theory
While the dividend yield theory has proven to be a useful valuation tool in many situations, it's important to realize that it works best under long-term conditions (5+ year time frames) and with quality dividend stocks that possess (1) secure dividends, (2) generous payouts, and (3) stable business models.
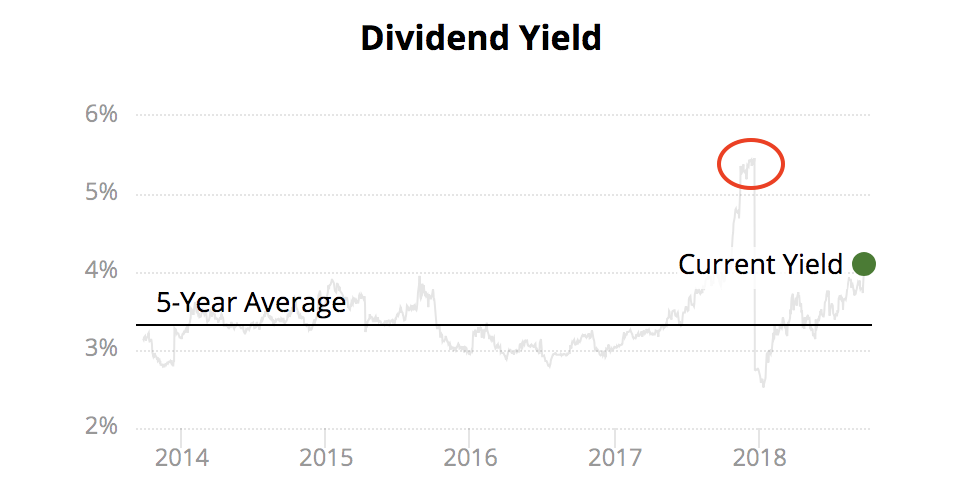
Let's start with stocks that have riskier payouts. General Electric (GE) is a good example, and you can see its five-year dividend yield history below. If you came across the stock during the second half of 2017, you would have seen that GE's yield was abnormally high, suggesting the stock could be cheap.
However, rather than indicating value, the stock's high yield was a signal that a dividend cut was imminent. Sure enough, in late 2017 you can see GE's yield actually plunged below its five-year average following its dividend cut.
General Electric (GE)
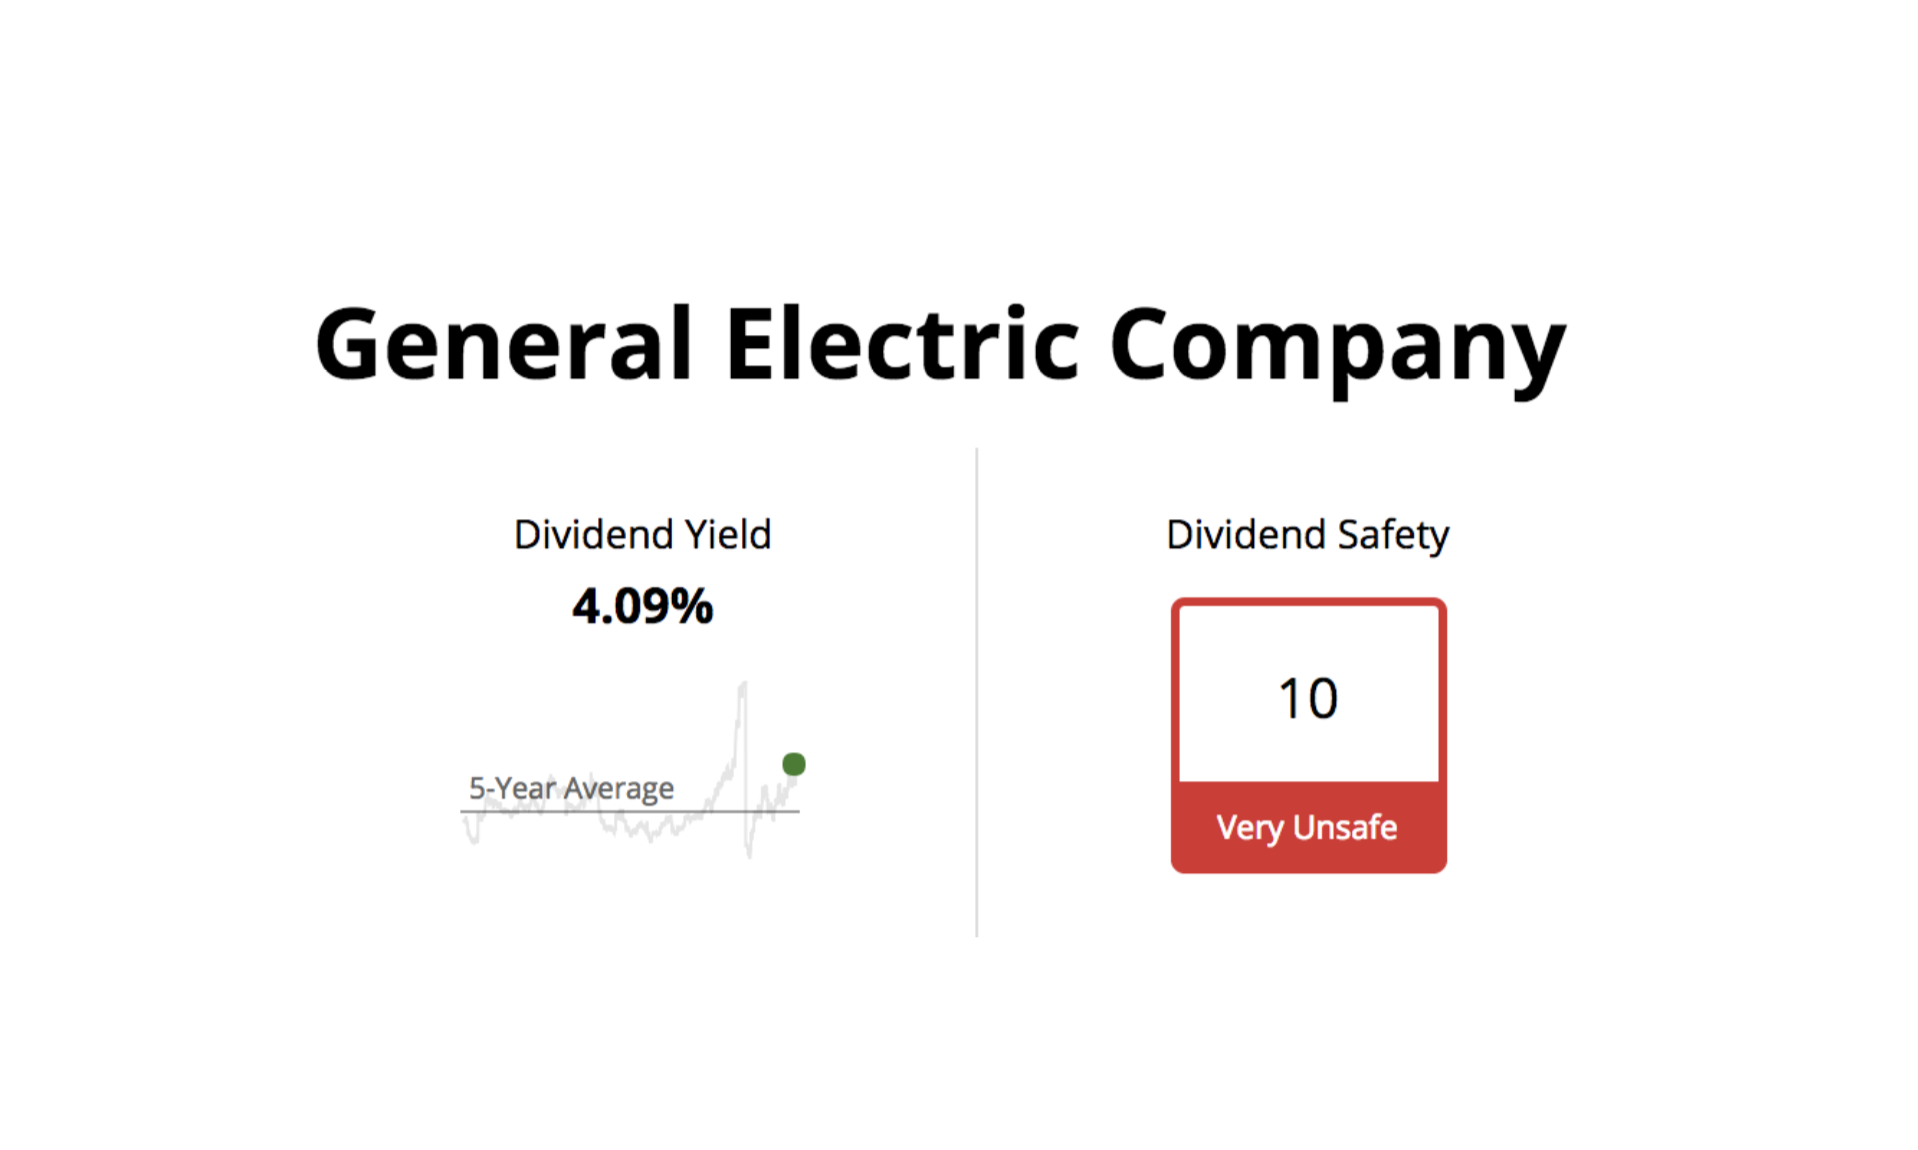
To help income investors avoid these misleading yield traps, we created a Dividend Safety Score system which identifies companies at risk of reducing their payouts. In GE's case, you can quickly see that its dividend appears to be very unsafe according to our rating, suggesting that its relatively high dividend yield is not to be trusted as an indicator of value.
Source: Simply Safe Dividends
Besides stocks with potentially unsafe payouts, dividend yield theory doesn't work well for companies with paltry dividends. A stock's long-term returns are a function of the dividends it pays and its capital appreciation, which is primarily fueled by growth in its earnings (remember, stock prices follow earnings over the long term).
So if a growth-oriented company pays out a very small portion of its earnings as a dividend (i.e. a very low payout ratio), then dividends will likely have a relatively small impact on the stock's total returns going forward. Instead, long-term total returns will be driven almost entirely by earnings growth.
Dividend aristocrat Roper Technologies (ROP) is a good example. The company's payout ratio is less than 20%, and you can see that its dividend yield has remained well below 1% over the past five years.
Roper Technologies (ROP)
Rather than cranking up its payout ratio and returning more cash to shareholders, Roper is reinvesting its earnings into numerous profitable growth opportunities to continue expanding its business.
For fast-growing companies like Roper that have low payout ratios and tiny dividend yields, a P/E ratio approach is usually a more helpful indicator of value since it captures a much more complete picture of the stock's primary total return driver (earnings rather than its small dividend).
Finally, dividend yield theory is most appropriately applied to companies with consistent and predictable business models. For example, most utilities, REITs, and dividend aristocrats usually have business models that don't change much over the years.
This stability helps the market to establish a relatively stable trading range for the stock's dividend yield since its value drivers are steady and fairly straightforward.
However, if a firm's business model changes dramatically, permanently altering its long-term outlook for profitable growth, then the stock's historical dividend yield trading rating may no longer be relevant. In other words, the stock's latest dividend yield is not abnormally high or low but actually represents the new normal going forward.
Now it should be noted that even blue chips such as dividend aristocrats and dividend kings periodically undergo periods of slow or even negative growth (especially cyclical companies like industrials).
However, these companies have a proven track record of adapting to changing industry conditions over time, including corporate restructurings that usually return them to stable growth in due time. Therefore, it's important to not overreact to one or two bad years of financial results, but keep in mind the long-term growth trends and competitive advantages of a company.
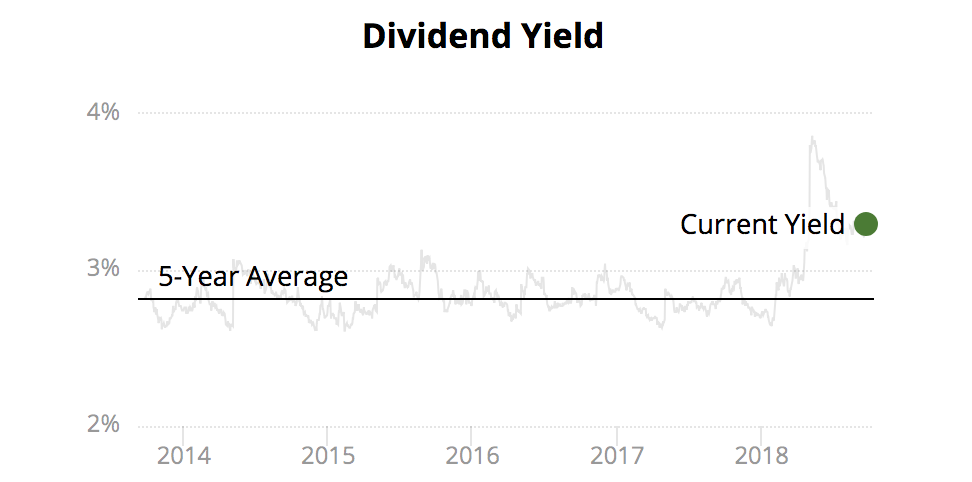
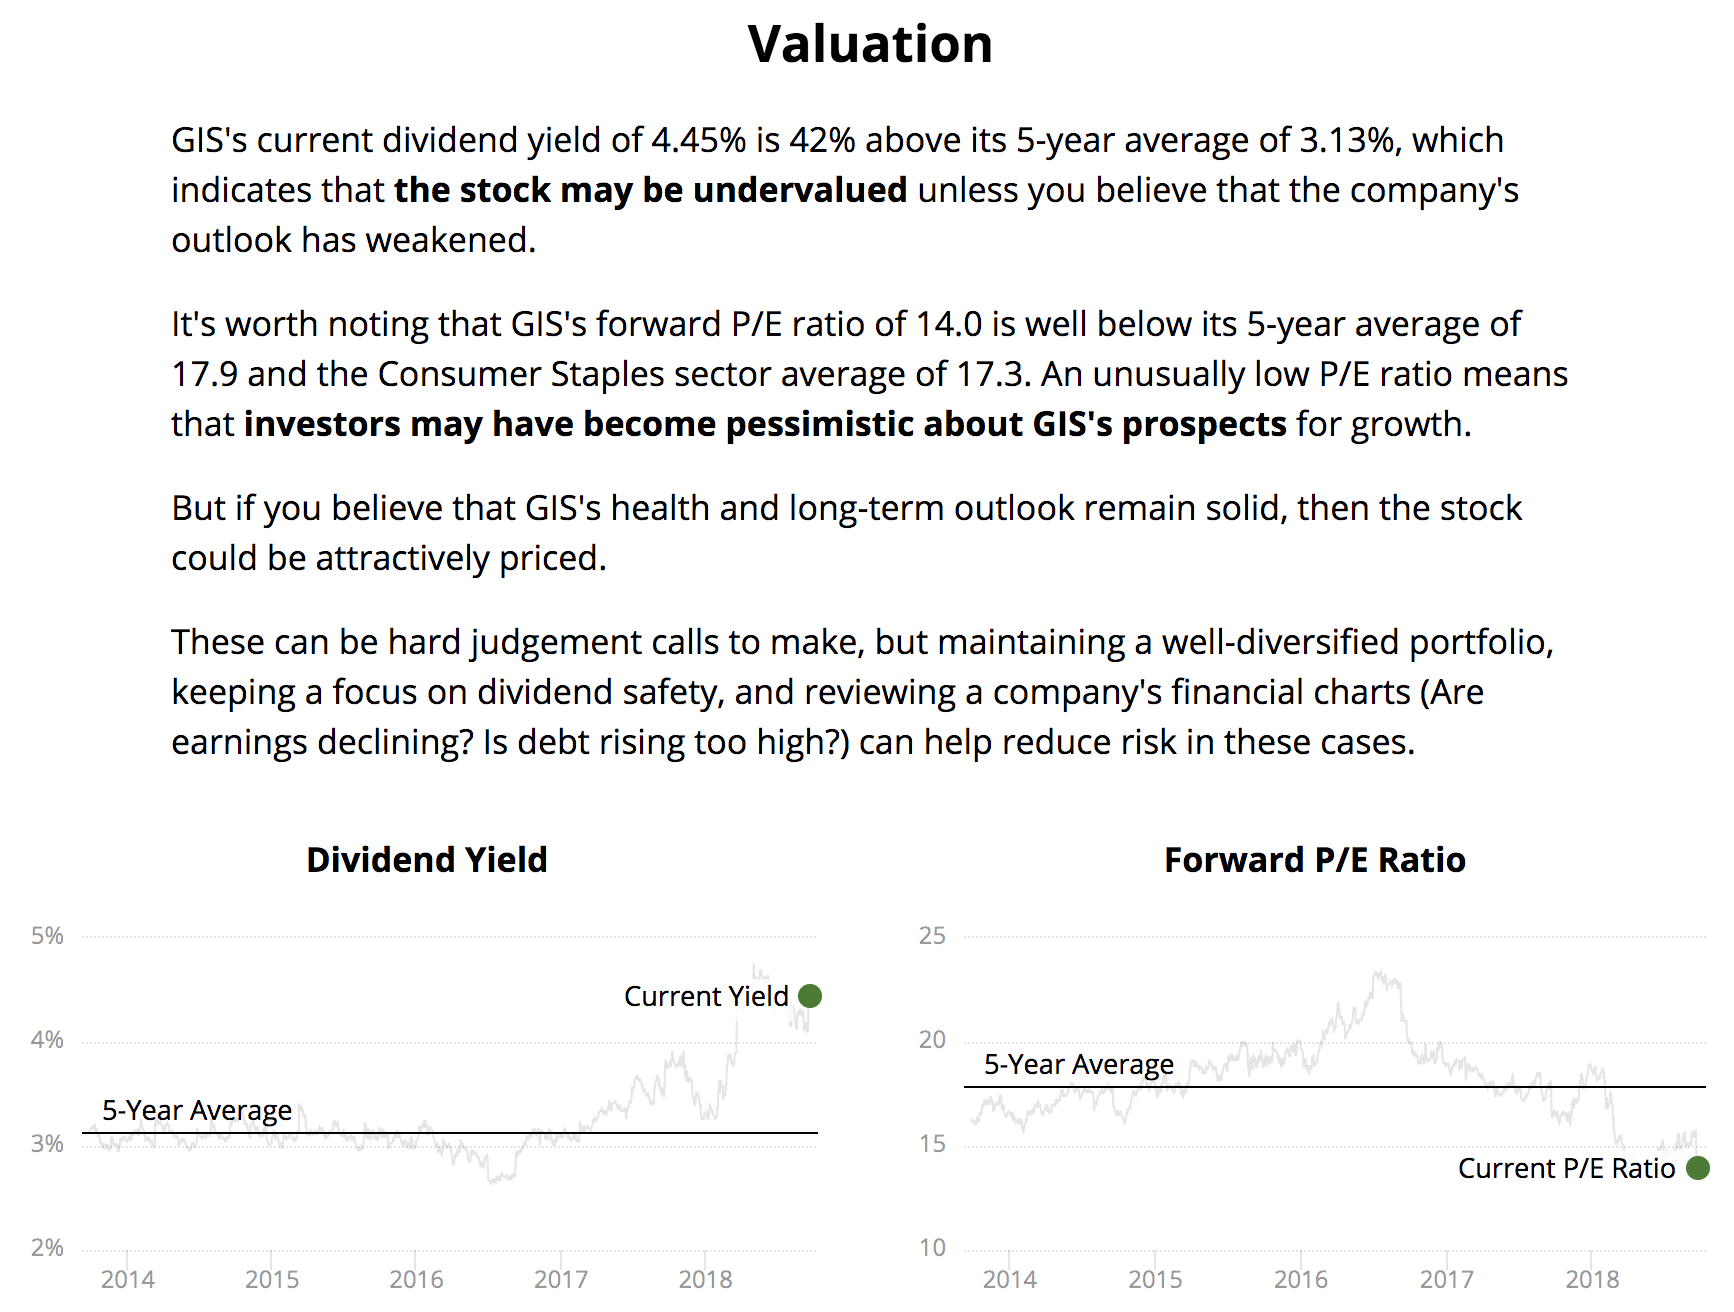
General Mills (GIS) is a good example. The consumer staples giant has paid uninterrupted dividends for more than 115 years and is a cash cow. However, the firm has struggled to evolve its food portfolio quickly enough to meet growing consumer preferences for healthier offerings.
As a result, General Mills is in the middle of a turnaround effort to restore its business to profitable growth. Part of the plan included a pricey $8 billion acquisition of natural pet food maker Blue Buffalo which resulted in management freezing the firm's dividend to help pay down debt.
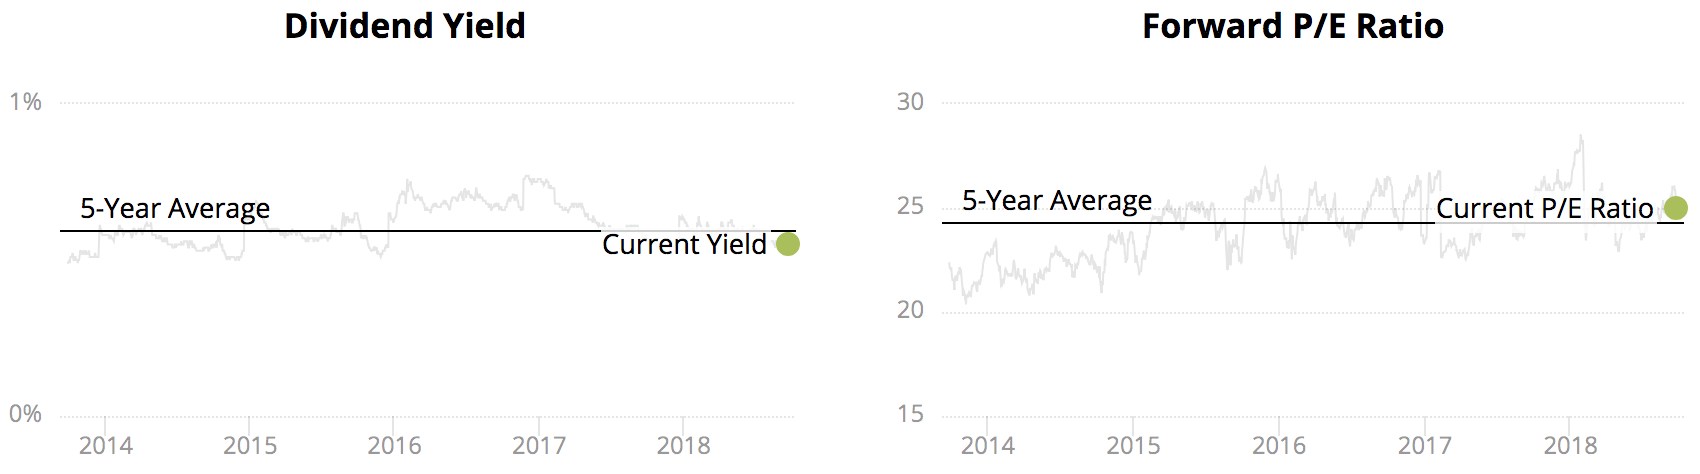
Given these moving parts and some of the industry's growth challenges, you can see below that General Mills' stock trades at an abnormally high dividend yield and a relatively low P/E ratio.
Our website does its best to explain how to think about a stock's current valuation, especially in these trickier situations. In this case, if you believe General Mills can eventually bounce back like it has for more than a century, the stock could be attractively priced.
Source: Simply Safe Dividends
Investors should periodically check in on even blue-chip stocks to make sure their fundamental investment theses remain intact and that their long-term growth potential hasn't become permanently impaired.
Closing Thoughts on Dividend Yield Theory
No valuation model is perfect. But for long-term income investors, dividend yield theory can be a useful method to minimize your chances of overpaying for most types of dividend growth stocks.
As long as a company's business model is stable over time, its payout safe and fairly generous, and its long-term outlook intact, the stock's dividend yield will often establish a trading range over time and tend to be mean reverting.
Thus a blue-chip stock's historical dividend yield can provide a reasonable fair value proxy that you can use to ensure you're buying wonderful companies at a fair price or better.
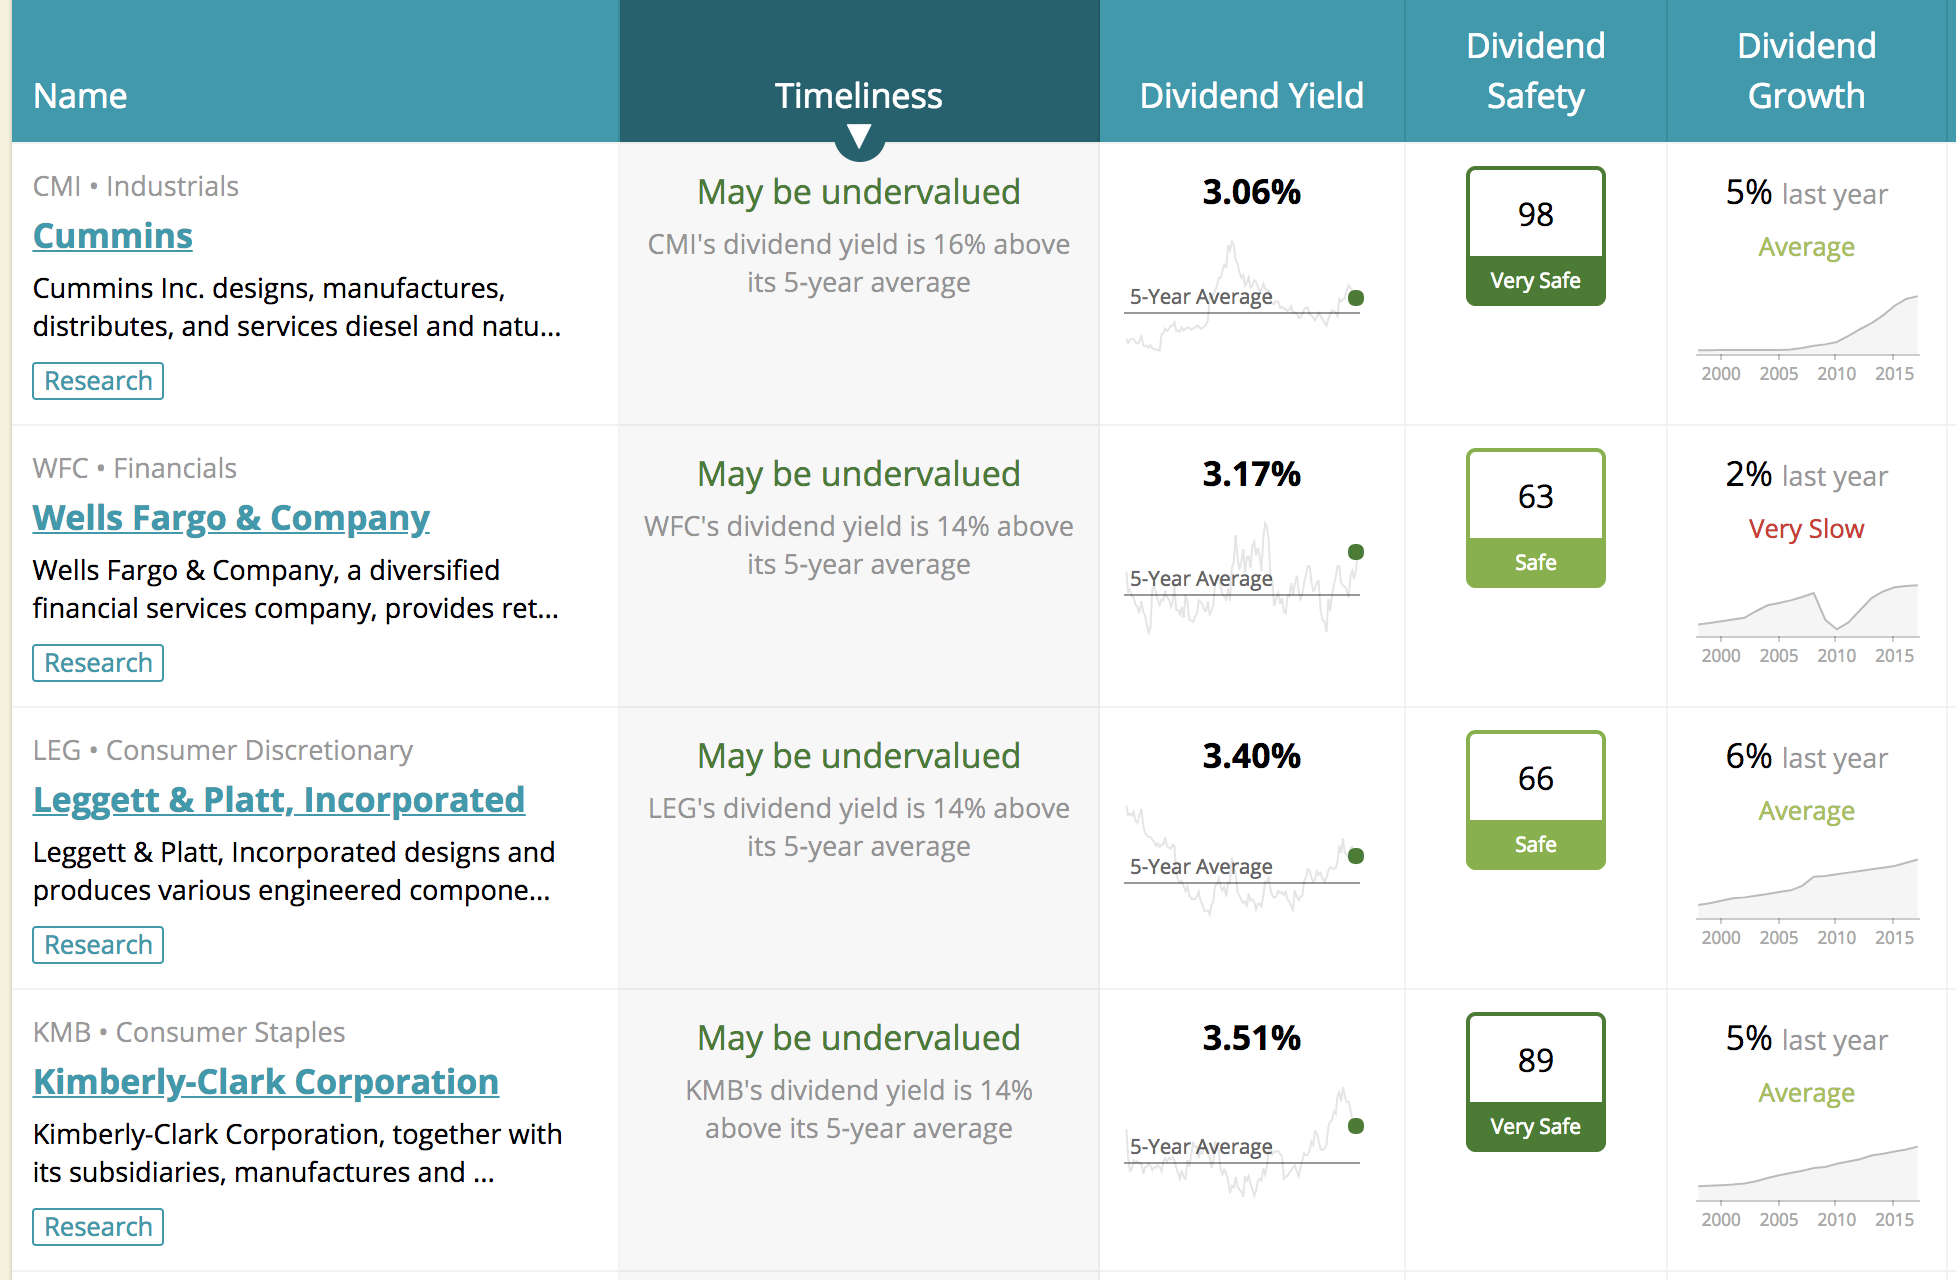
To help income investors use dividend yield theory responsibly, our website provides long-term dividend yield charts for thousands of stocks. We also include a comparison of a stock's current dividend yield to its five-year average yield across our various tools (portfolio tracker, screener, idea lists, etc.).
This makes it easier to quickly identify not just whether a stock appears to be over or undervalued, but also to determine the most timely places to invest new money for income today.
Source: Simply Safe Dividends